In the previous post I got a great, if obvious and easy performance improvement by moving from a naive implementation (but one that helped me make initial headway in understanding the WebAssembly spec) to something much more sensible.
The very simple measuring I think puts me somewhere around python performance, but can I do better?
At the moment, I’m not quite ready to think about JITing code, but is there something that I can do whilst keeping the interpretation model?
Measure
Using valgrind in the previous post I examined, at a function level, the relative time spent in different functions and optimised out functions that were unnecessarily called during execution.
However, this function-level view isn’t ideal where the bulk of our work happens in a single interpret function; the granularity is too course.
Let’s remedy this by having valgrind give us instruction-level data. Additionally, we will ask valgrind to simulate branch prediction (and you will see why as this post unfolds).
To invoke valgrind, then, we’ll use the following:
valgrind --tool=callgrind --cache-sim=yes --branch-sim=yes --dump-instr=yes ./fibdump-instrgives us the instruction-level informationcache-simwill give us information about cache missesbranch-simwill give us branch prediction simulation
So what does this new valgrind output tell us? Let’s see:
➜  foxwren git:(master) ✗ valgrind --tool=callgrind  --cache-sim=yes --branch-sim=yes --dump-instr=yes ./fib
==78045== Callgrind, a call-graph generating cache profiler
==78045== Copyright (C) 2002-2017, and GNU GPL'd, by Josef Weidendorfer et al.
==78045== Using Valgrind-3.16.0 and LibVEX; rerun with -h for copyright info
==78045== Command: ./fib
==78045==
--78045-- warning: L3 cache found, using its data for the LL simulation.
==78045== For interactive control, run 'callgrind_control -h'.
out = 317811
==78045==
==78045== Events    : Ir Dr Dw I1mr D1mr D1mw ILmr DLmr DLmw Bc Bcm Bi Bim
==78045== Collected : 1125625904 341650415 256821381 477 125 1905 477 76 1683 140077345 1029056 13612869 13612800
==78045==
==78045== I   refs:      1,125,625,904
==78045== I1  misses:              477
==78045== LLi misses:              477
==78045== I1  miss rate:          0.00%
==78045== LLi miss rate:          0.00%
==78045==
==78045== D   refs:        598,471,796  (341,650,415 rd + 256,821,381 wr)
==78045== D1  misses:            2,030  (        125 rd +       1,905 wr)
==78045== LLd misses:            1,759  (         76 rd +       1,683 wr)
==78045== D1  miss rate:           0.0% (        0.0%   +         0.0%  )
==78045== LLd miss rate:           0.0% (        0.0%   +         0.0%  )
==78045==
==78045== LL refs:               2,507  (        602 rd +       1,905 wr)
==78045== LL misses:             2,236  (        553 rd +       1,683 wr)
==78045== LL miss rate:            0.0% (        0.0%   +         0.0%  )
==78045==
==78045== Branches:        153,690,214  (140,077,345 cond +  13,612,869 ind)
==78045== Mispredicts:      14,641,856  (  1,029,056 cond +  13,612,800 ind)
==78045== Mispred rate:            9.5% (        0.7%     +       100.0%   )
The key line:
==78045== Mispred rate: 9.5% ( 0.7% + 100.0% )This output is giving us conditional mispredictions and indirect mispredictions. The conditional mispredictions are 0.7% (fine) but the indirect mispredictions are 100%! The branch predictor failed every time!
Branch predictor:

But, we have to treat this with a little caution because the sim in branch-sim means exactly that…valgrind is simulation the branch predictor. Indeed, it’s quite particular in what it is simulating. From the documentation:
Cachegrind simulates branch predictors intended to be typical of mainstream desktop/server processors of around 2004.
and later
For indirect branches (that is, jumps to unknown destinations) Cachegrind uses a simple branch target address predictor. Targets are predicted using an array of 512 entries indexed by the low order 9 bits of the branch instruction’s address. Each branch is predicted to jump to the same address it did last time. Any other behaviour causes a mispredict.
More recent processors have better branch predictors, in particular better indirect branch predictors. Cachegrind’s predictor design is deliberately conservative so as to be representative of the large installed base of processors which pre-date widespread deployment of more sophisticated indirect branch predictors.
So an actual machine’s branch predictor may do a better job. Thus, having used valgrind to optimise any of the branch mispredictions, we’ll have to test actual runtimes to see if we improve. Where we see a large improvement from valgrind we me see less of an improvement when actually running the code.
With that in mind, let’s continue on. Digging in with kcachegrind, we see the following:
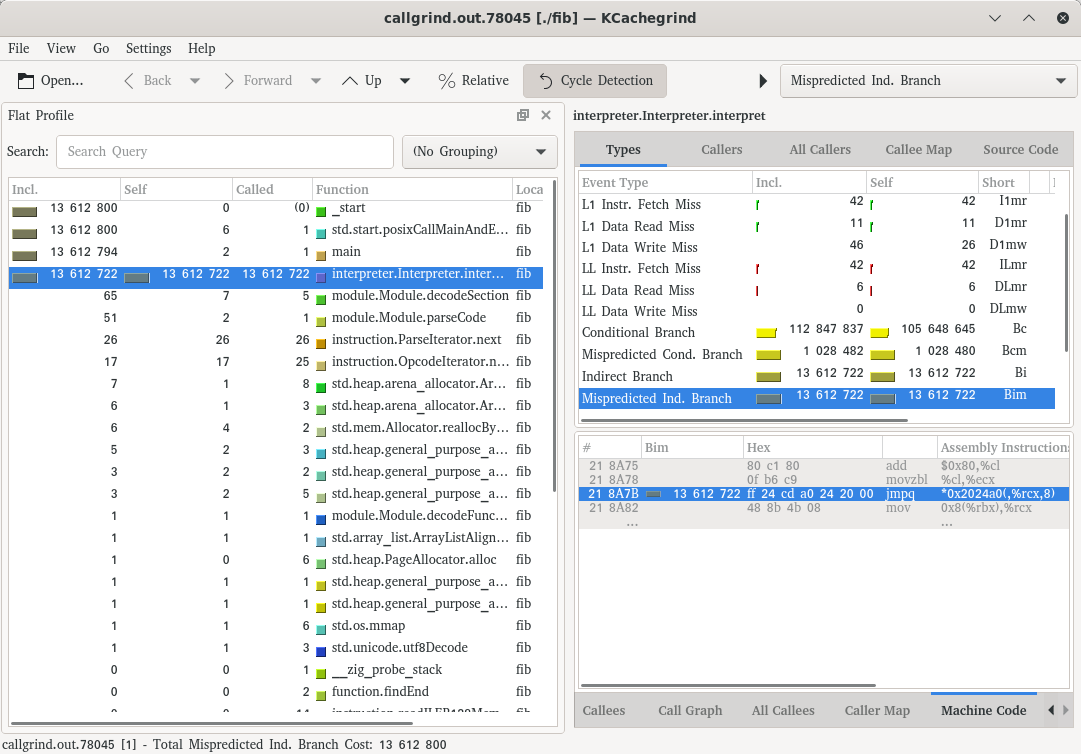
We have 13,612,722 indirect branches and of those, 13,612,722 predictions were wrong. All on the same jmpq instruction (at address 218a7b). This jmpq instruction is right at the start of our interpret function:
0000000000218a50 <interpreter.Interpreter.interpret>:
  218a50:	55                   	push   %rbp
  218a51:	41 57                	push   %r15
  218a53:	41 56                	push   %r14
  218a55:	41 55                	push   %r13
  218a57:	41 54                	push   %r12
  218a59:	53                   	push   %rbx
  218a5a:	48 81 ec a8 01 00 00 	sub    $0x1a8,%rsp
  218a61:	31 c0                	xor    %eax,%eax
  218a63:	84 c0                	test   %al,%al
  218a65:	0f 85 73 69 00 00    	jne    21f3de <interpreter.Interpreter.interpret+0x698e>
  218a6b:	48 89 fb             	mov    %rdi,%rbx
  218a6e:	8a 4e 38             	mov    0x38(%rsi),%cl
  218a71:	66 b8 54 00          	mov    $0x54,%ax
  218a75:	80 c1 80             	add    $0x80,%cl
  218a78:	0f b6 c9             	movzbl %cl,%ecx
  218a7b:	ff 24 cd a0 24 20 00 	jmpq   *0x2024a0(,%rcx,8)
  218a82:	48 8b 4b 08          	mov    0x8(%rbx),%rcx
This instruction is our switch statement.
Now it should be clear why we have 100% indirect misprediction. The (simulated) branch predictor always assumes that we’re going to end up in the same branch of the switch statement as the previous run. Because no two consecutive WebAssembly instructions are the same opcode—in this particular fibonacci program—the branch predictor always guesses incorrectly.
Branch Predictor Model
I just want to stop here and dwell on the branch predictor. Particularly having a model inside your head of how the branch predictor is working. This is something I didn’t have a good hold on previously. Without a good working model some of the avaiable literature on speeding up interpreters is difficult to model.
So here we state a model: the branch predictor has bit of memory associated with different instructions, and we can look up a particular slot based upon the memory address of the instruction. The value stored in this memory location is where the branch predictor thinks we’ll end up, based upon previous information. In the case of valgrind it is simple the address it jumped to the last time it executed the instruction at that address.
Possible improvements
So what does the 100% misprediction boil down to?
Ultimately we have a simple branch predictor and we only have a single slot with which to store a predicted value (because all mispredictions occur at the same instruction).
What about a combination of the following:
-
if we can increase the number of instructions doing the indirect jumps, we’ll have more memory slots for predicted values
-
with the single instruction we have a single slot to predict all instructions, and so we can’t exploit any structure in WebAssembly code, even though we know there is structure. We have the instructions available, can we somehow get this information to the branch predictor?
There are a couple of suggestions in the literature; let’s take a look at an easy if ugly approach.
Copy the switch statement
In this approach we simply copy (as in copy and paste) the switch statement and paste a copy under each branch of the existing switch statement (with a little bit of code to first increment the instruction pointer) after the code that performs the particular operation of that particular branch.
In the case of zig, we can’t quite just copy and paste because it won’t let us shadow variables, and so a bit of renaming is required.
If we do this for every instruction we will 178 + 1 instructions we are indirectly branching from (178 because that’s how many WebAssembly instructions are implemented). So firstly we have a bunch more slots avaiable in our branch predictor that we can use to record guesses as where to go next.
But notice the other benefit of this, that is perhaps less obvious: having the duplicate of the switch statement within a paritcular opcode handle gives us something better than the toplevel switch statement…we know that the next instruction occurs after an example of the current instruction.
To clarify with an example: if we look at the switch copy within the local.get instruction handler, for the particular fibonacci program, we always perform an i32.const. This is great, after local.get then, we’ll always get 100% correct prediction, so our mispredition rate will fall and we should see an increase in execution speed.
Taking a look at call, if we do the same, we have two possibilities either we end up calling local.get or we end up calling i32.add and it is less clear how well we will predict. They alternate and so at a glance you may think they will always mispredict, but remember with call we will (effectively) jump back to the top of the execution and so we will end up not alternating. Of course we can’t know ahead of time the structure in the particular WebAssembly program that we load in and therefore we really need to do this copy n’ paste job for all instructions.
Having added a copy of the switch statement to the local.get and call handlers we get the following result:
➜  foxwren git:(malcolm/opt-test-replicate) ✗ valgrind --tool=callgrind  --cache-sim=yes --branch-sim=yes --dump-instr=yes ./fib
==81049== Callgrind, a call-graph generating cache profiler
==81049== Copyright (C) 2002-2017, and GNU GPL'd, by Josef Weidendorfer et al.
==81049== Using Valgrind-3.16.0 and LibVEX; rerun with -h for copyright info
==81049== Command: ./fib
==81049==
--81049-- warning: L3 cache found, using its data for the LL simulation.
==81049== For interactive control, run 'callgrind_control -h'.
out = 317811
==81049==
==81049== Events    : Ir Dr Dw I1mr D1mr D1mw ILmr DLmr DLmw Bc Bcm Bi Bim
==81049== Collected : 1077542178 332151519 228960317 487 125 1907 487 77 1683 137188393 1029048 13612869 10723849
==81049==
==81049== I   refs:      1,077,542,178
==81049== I1  misses:              487
==81049== LLi misses:              487
==81049== I1  miss rate:          0.00%
==81049== LLi miss rate:          0.00%
==81049==
==81049== D   refs:        561,111,836  (332,151,519 rd + 228,960,317 wr)
==81049== D1  misses:            2,032  (        125 rd +       1,907 wr)
==81049== LLd misses:            1,760  (         77 rd +       1,683 wr)
==81049== D1  miss rate:           0.0% (        0.0%   +         0.0%  )
==81049== LLd miss rate:           0.0% (        0.0%   +         0.0%  )
==81049==
==81049== LL refs:               2,519  (        612 rd +       1,907 wr)
==81049== LL misses:             2,247  (        564 rd +       1,683 wr)
==81049== LL miss rate:            0.0% (        0.0%   +         0.0%  )
==81049==
==81049== Branches:        150,801,262  (137,188,393 cond +  13,612,869 ind)
==81049== Mispredicts:      11,752,897  (  1,029,048 cond +  10,723,849 ind)
==81049== Mispred rate:            7.8% (        0.8%     +        78.8%   )
Excellent, we’ve dropped from 100% misprediction to 78.8% misprediction. How does kcachegrind look now:
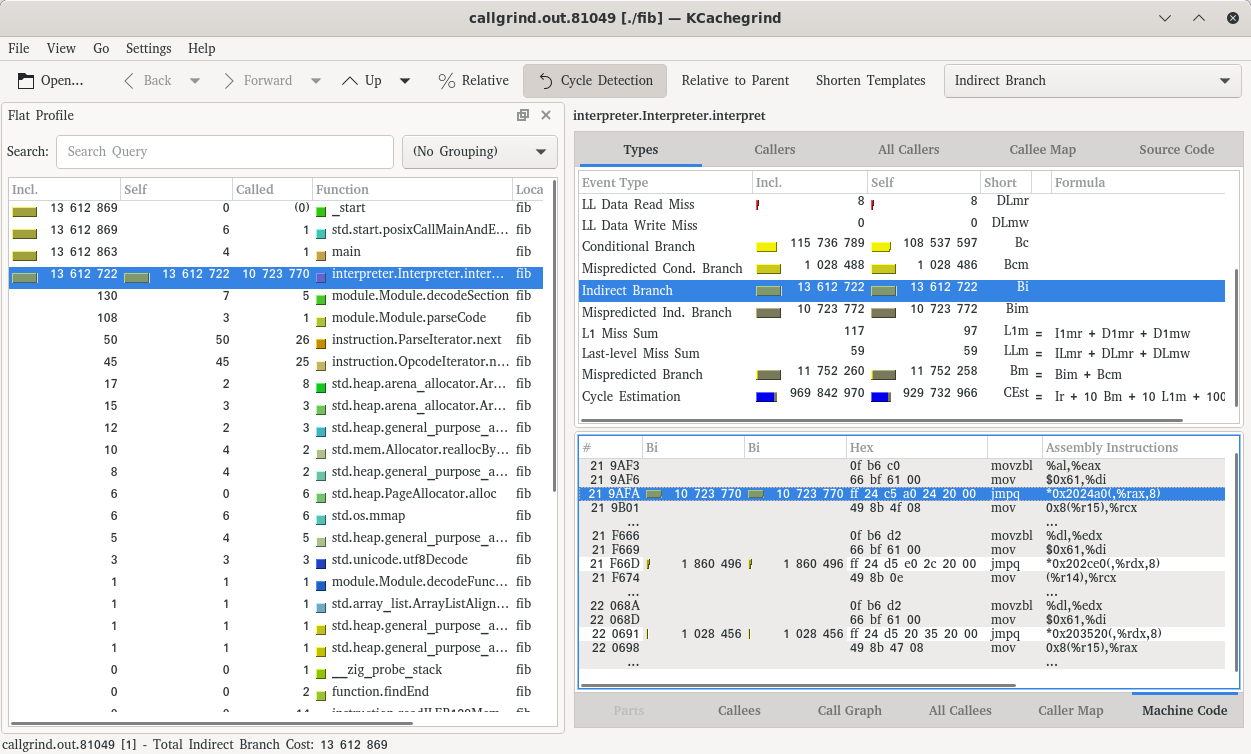
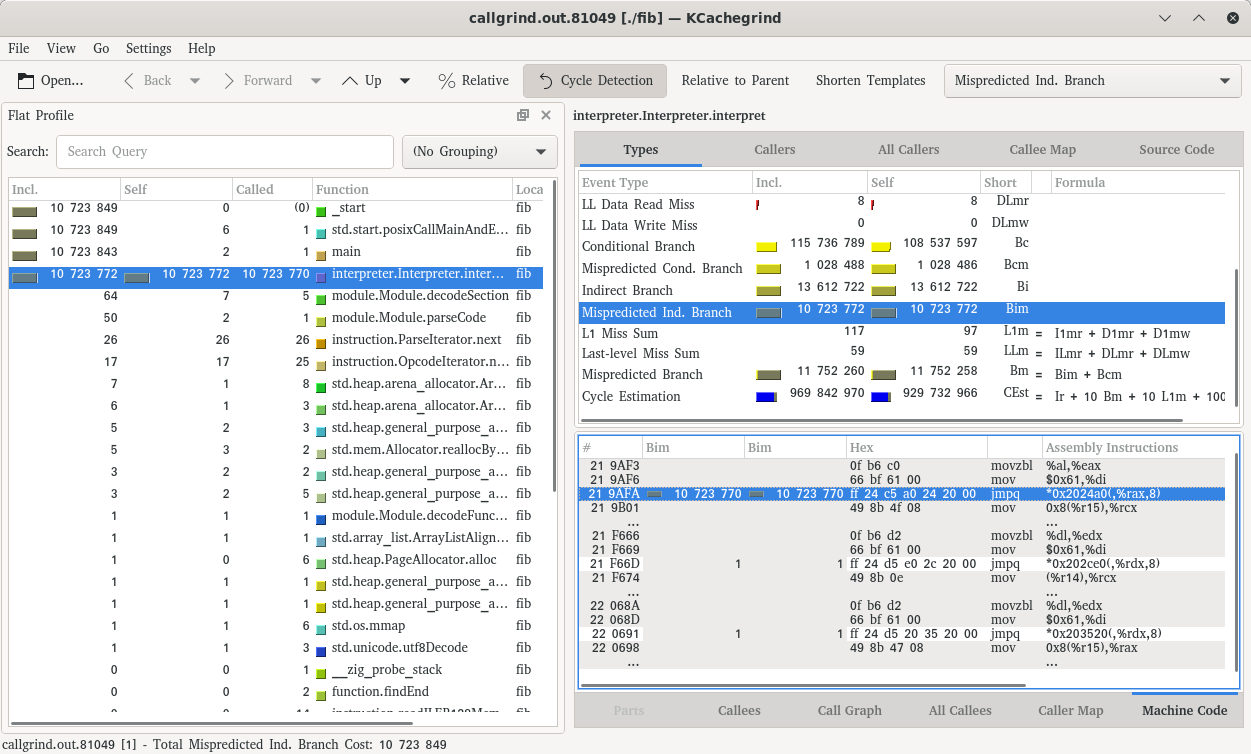
We now have three jmpq instructions:
- the toplevel switch
- a repeated switch under
call - a repeated switch under
local.get
Note that we still mispredict all instructions at the toplevel, but now note what happens for the jmpqs for call and local.get. They both have 1 to 2 million indirect branches but the corresponding mispredictions is only 1 a piece! Awesome!
Now, in language with code generation, this might not be a totally daft thing to do. Indeed, you could actually continue this copy/paste approach for an arbitrary number of levels deep. In doing so you would exploit more and more of structure existing in a particular program, e.g. you’d have a slot in the branch predictor for guessing where you end up after an i32.add that occured after a call. You start to get quite specific and I imagine you would get quite a nice speed increase. You are paying for it of course in the size of your executable and that size increase could have a negative impact on execution speed for other reason. In Lisp you could write a macro that generates a copy of the switch statement in each branch, to an arbitrary depth and it wouldn’t be so bad. But in zig we can’t really do that, so I’m not going to follow through with this approach into the foxwren codebase.
Back to reality
Okay, we’ve managed to improve our misprediction rate, but is branch-sim reflective of reality. Reality being this Macbook Air circa 2012? Alas it appears not (and, dear reader, this pains me because I initially thought I was seeing an actual increase but I think I’d compiled ReleaseFast the first time I tried this out).
With the duplicated code I don’t really see any difference in execution time of fib (I intially thought I’d gained around 5 seconds out of 30 seconds). For this Ivy Bridge machine, this document suggests:
Indirect jumps and indirect calls (but not returns) are predicted using the same two-level predictor as branch instructions.
The “same two-level predictor” is:
There appears to be a two-level predictor witha 32-bit global history buffer and a history pattern table of unknown size.
I’m still trying to grok two-level predictors but intuitively it seems like it has enough memory to exploit the patterns that appear in our fib program.
perf
Given that branch-sim is conservative, it is misleading us into thinking we can improve execution speed by fixing branch misprediction. It seems we aren’t, in practive, seeing branch misprediction. Can we measure the real world case?
This LWN article shows an example of using perf to calculate branch misprediction. Let’s run:
perf record -b perf stat ./fibThis will dump out a perf.data that we can then process and display the results of with:
perf report --sort symbol_from,symbol_to,mispredictThis gives the following output:
Samples: 3K of event 'cycles', Event count (approx.): 3440
Overhead  Source Symbol                          Target Symbol                          Branch Mispredicted  IPC   [IPC Coverage]
  21.31%  [.] interpreter.Interpreter.interpret  [.] interpreter.Interpreter.interpret  N                    0.00  [  0.0%]
   6.66%  [.] main                               [.] interpreter.Interpreter.interpret  N                    0.00  [  0.0%]
   6.42%  [.] main                               [.] main                               N                    0.00  [  0.0%]
   5.99%  [.] interpreter.Interpreter.interpret  [.] main                               N                    0.00  [  0.0%]
   5.49%  [.] do_lookup_x                        [.] do_lookup_x                        N                    0.00  [  0.0%]
   2.50%  [k] interpreter.Interpreter.interpret  [k] interpreter.Interpreter.interpret  Y                    0.00  [  0.0%]
   2.12%  [k] __UNIQUE_ID_ddebug102.44074+0x...  [k] __UNIQUE_ID_ddebug102.44074+0x...  N                    0.00  [  0.0%]
   1.57%  [.] _dl_relocate_object                [.] _dl_relocate_object                N                    0.00  [  0.0%]
   1.40%  [k] 0xffffffff8700cfa2                 [k] 0xffffffff8706e550                 N                    -
   1.40%  [k] 0xffffffff87012435                 [k] 0xffffffff8700cf86                 N                    -
   1.37%  [k] 0xffffffff8706e55b                 [k] 0xffffffff87012431                 N                    -
   1.10%  [.] _dl_lookup_symbol_x                [.] _dl_lookup_symbol_x                N                    0.00  [  0.0%]
   1.02%  [k] 0000000000000000                   [k] 0000000000000000                   N                    -
   0.76%  [.] build_trtable                      [.] build_trtable                      N                    0.00  [  0.0%]
   0.67%  [k] interpreter.Interpreter.pushFrame  [k] interpreter.Interpreter.pushFrame  N                    0.00  [  0.0%]
   0.61%  [k] interpreter.Interpreter.interpret  [k] interpreter.Interpreter.pushFrame  N                    0.00  [  0.0%]
   0.55%  [k] interpreter.Interpreter.pushFrame  [k] interpreter.Interpreter.interpret  N                    0.00  [  0.0%]
From the LWN article, we are interested in rows where Branch Mispredicted == Y. We can see the largest overhead is 21.31% within Interpreter.interpret but this is not overhead from branch mispredication but something else. The following line shows the branch misprediction in Interpreter.interpret:
2.50% [k] interpreter.Interpreter.interpret [k] interpreter.Interpreter.interpret Y 0.00 [ 0.0%]So perf is telling us that we are only experiencing 2.5% overhead from branch misprediction. This seems to tie up with the fact that we’re not seeing any increase in performance after having attempted to help out the branch predictor. The branch predictor is already doing a reasonable job and hints that we need to find our performance elsewhere.