In February 2021 I started work on a WebAssembly interpreter written in Zig. With this commit I have all but a few baseline spec testsuite tests passing.
Part of the reason was purely to learn how WebAssembly works, and in that respect the peformance of the interpreter was a secondary concern. However, I would like to see if I can at least take care of some low-hanging optimisations.
The most obvious of these is the fact that the interpreter operates directly on bytes slices read from
.wasm file. There is no processing at all. This means there are several bits of work that occur
during execution that we could calculate once when decoding / instantiating a module.
Of these there are at least two:
- Reading immediate LEB128 values
- Finding the end of blocks
The test
For this initial optimisation I will use a naive Fibonacci program for measuring before and after performance. I will also compare the runtime to other programming languages.
The WebAssembly code for our Fibonacci program is:
(module
  (type $t (func (param i32) (result i32)))
  (func $fib (type $t) (param $n i32) (result i32)
    local.get $n
    i32.const 0
    i32.eq
    if $I0
      i32.const 0
      return
    end
    local.get $n
    i32.const 1
    i32.eq
    if $I1
      i32.const 1
      return
    end
    local.get $n
    i32.const 2
    i32.sub
    call $fib
    local.get $n
    i32.const 1
    i32.sub
    call $fib
    i32.add
    return)
  (export "fib" (func $fib)))
Current performance
My baseline performance will be using the code from this commit.
Let’s try Fibonacci of 39:
➜  foxwren git:(master) time ./fib
out = 63245986
./fib  82.54s user 0.00s system 99% cpu 1:22.74 total
And python:
➜  foxwren git:(master) time python3 ~/fib.py
63245986
python3 ~/fib.py  35.06s user 0.02s system 99% cpu 35.152 total
Okay, so we’re very slow compared to what python is doing, let alone anything faster.
I should also note that I’ve compiled the Zig fib with release safe.
zig build-exe src/fib.zig -O ReleaseSafeWith, ReleaseFast we get quite a bit faster. We probably don’t want
to execute arbitrary .wasm with ReleaseFast, but that said, if you
trust the foxwren code and you perform validation of .wasm binary
then in theory there should be nothing wrong running with ReleaseFast.
A malicious WebAssembly program would not be able to hurt us.
Let’s try ReleaseFast just as a comparison:
➜  foxwren git:(master) zig build-exe src/fib.zig -O ReleaseFast
➜  foxwren git:(master) time ./fib
out = 63245986
./fib  58.94s user 0.00s system 99% cpu 59.041 total
Okay, a really nice speed up.
Note also, and I haven’t checked, the python code might be doing some
level of optimisation such as replacing the two conditionals n == 0
and n == 1 with a single initial conditional of n < 2 and then
the two conditionals, such that for most iterations only a single
conditional is checked. But in our case, making such an optimisation
may actually make our code slower because we’re not doing any preprocessing.
Therefore I will ignore that possibility and come back to it after we’ve
made some improvements.
Measure
Now, I’ve no doubt that constantly redecoding LEB128s is not going to help our performance, but how bad is it? The WebAssembly binary format encodes all integers as LEB128 to minimise the size of the result WebAssembly binaries.
For this I used valgrind’s cachegrind option along with kcachegrind. I also reduced the Fibonacci number just to get cachegrind to run faster:
➜  foxwren git:(master) valgrind --tool=callgrind ./fib
==831457== Callgrind, a call-graph generating cache profiler
==831457== Copyright (C) 2002-2017, and GNU GPL'd, by Josef Weidendorfer et al.
==831457== Using Valgrind-3.16.0 and LibVEX; rerun with -h for copyright info
==831457== Command: ./fib
==831457==
==831457== For interactive control, run 'callgrind_control -h'.
out = 1346269
==831457==
==831457== Events    : Ir
==831457== Collected : 5737821327
==831457==
==831457== I   refs:      5,737,821,327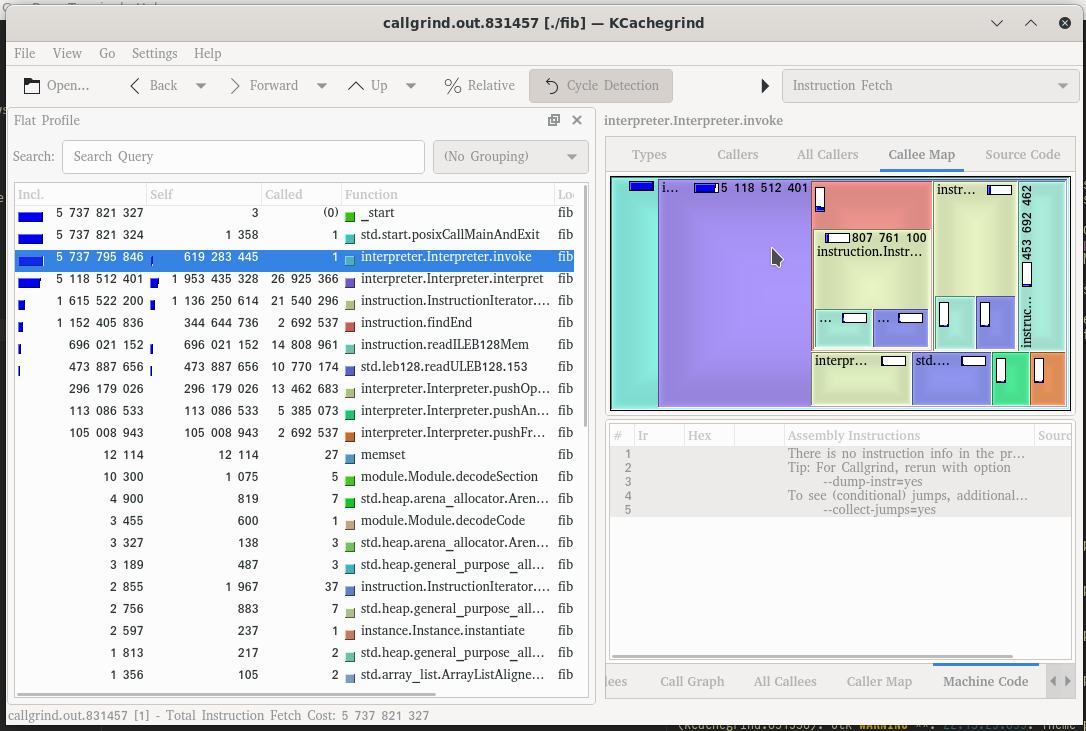
Right, we’re spending a bunch of time in interpret as you might expect. Let’s
ignore that for the moment because we need to be doing that to an extent. But
not that we’re also spending a lot of time doing InstructionIterator.next(),
findEnd, readULEB128Mem and std.leb.readULEB128.
These four functions are repeating the same work over and over again of finding
the end opcode that matches a particular block and reading immediate values
(LEB128 encoded) of instructions. Immediate values are things like function
indices that are baked into the binary (to be distinguished from instruction
arguments that are runtime values and on the stack).
A lot of these LEB128 numbers are actually u32 at runtime, so we can just
decode these once on loading the module. Similarly we can find block ends
once at runtime. Hopefully these two changes will give us a nice boost in
performance.
Optimisation
In this pull request you can see the changes that were made, namely:
- Rather than our WebAssembly functions being simply slices into the loaded
in bytes, I introduced an
ArrayListthat containsInstructions. Instructionis a tagged union overOpCodes.- Previously the
OpCodes were continuously re-evaluated - Now they are processed once up front into the
ArrayListofInstructions. - Different
Instructions have access to different bits of data, dependent on what immediate values they take - Execution now interprets slices of
Instructioninstead of the raw bytes, meaning we no longer are constantly parsing LEB128s or attempting to find theendpseudo-opcodes that delimit blocks.
With all the LEB128 parsing and end finding moved to the preprocessing stage we get a nice speed boost to put us on par with python:
➜  foxwren git:(malcolm/optimisation-1-preprocess) time ./fib
out = 63245986
./fib  33.69s user 0.02s system 99% cpu 33.833 total
Great!